[GSP139] Creating Custom Interactive Dashboards with Bokeh and BigQuery
https://www.qwiklabs.com/focuses/1820?parent=catalog
In this lab you will learn how to build a custom interactive dashboard application on Google Cloud Platform (GCP) by using the Bokeh library to visualize data from publicly available Google BigQuery datasets. You will also learn how to deploy this application with both security and scalability in mind.
Powerful software-as-a-service (SaaS) solutions like Data Studio are extremely useful when building interactive data visualization dashboards. However, these types of solutions might not provide sufficient customization options. For those scenarios, you can use open source libraries like D3.js, Chart.js, or Bokeh to create custom dashboards. While these libraries offer a lot of flexibility for building dashboards with tailored features and visualizations, a major challenge remains: deploying these dashboards to the internet to enable easy stakeholder access.
Objectives
- Learn how to connect to BigQuery from a custom application built using Bokeh.
- Implement optimization techniques, including parallel queries and application-level caching using Memcached.
- Deploy the dashboard demo to Google Kubernetes Engine using Kubernetes.
- Create an HTTPS Load Balancer.
- Deploy a CDN-enabled backend for serving static assets.
- Secure the application by using Cloud Identity-Aware Proxy authentication and SSL encryption.
Understanding the demo application
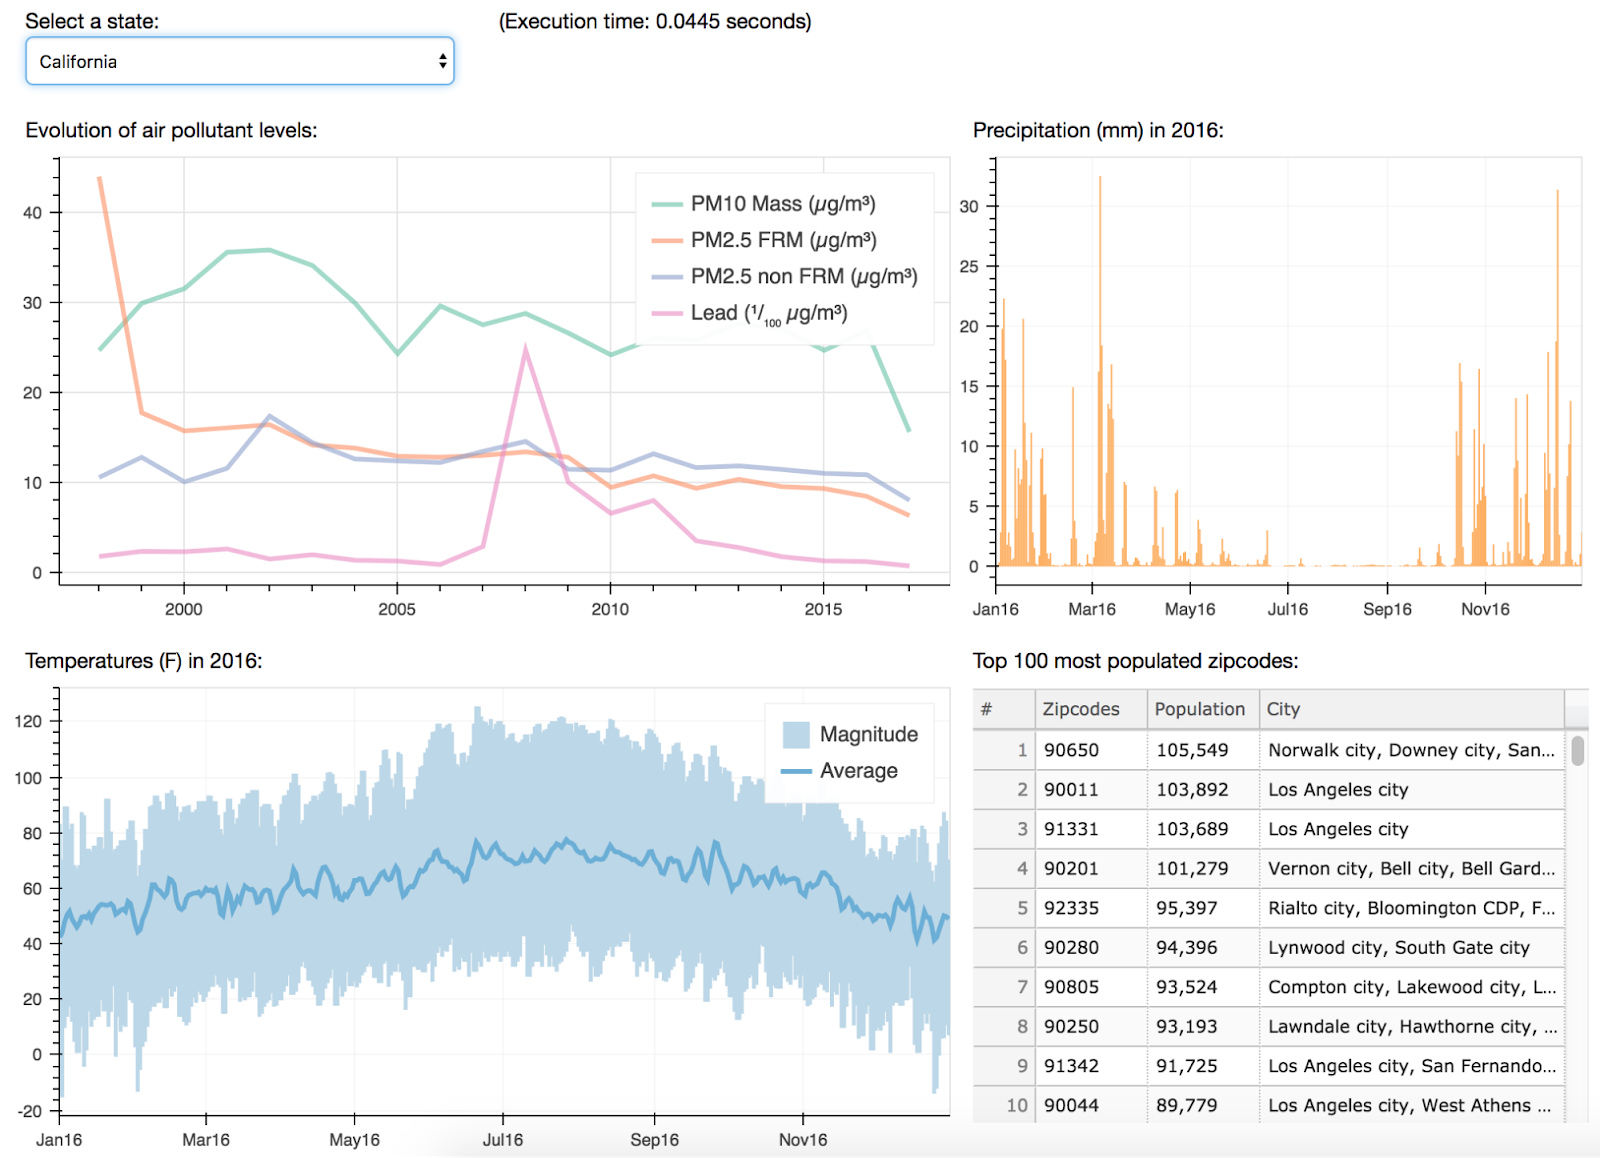
The demo application displays a dashboard that processes and visualizes publicly available data for all fifty U.S. states. The dashboard provides a simple level of interaction: the user can select any of the fifty states from a dropdown widget to drill down and display information about that state. The dashboard contains four different modules, and each module displays different types of information:
- A line plot shows the evolution of various air pollutant levels over the past several decades. Data comes from the EPA Historical Air Quality Dataset.
- A bar plot displays precipitation levels for the year 2016. Data comes from the NOAA Global Historical Climatology Network Weather Dataset.
- A line plot indicates the magnitude and average temperature levels for the year 2016. Data from the NOAA Global Surface Summary of the Day Weather Dataset.
- A table lists the top 100 most populated ZIP Codes. Data from the United States Census Bureau Dataset.
Overall architecture
At a high-level, the lab’s architecture consists of six main elements. The following diagram shows how these components interact:
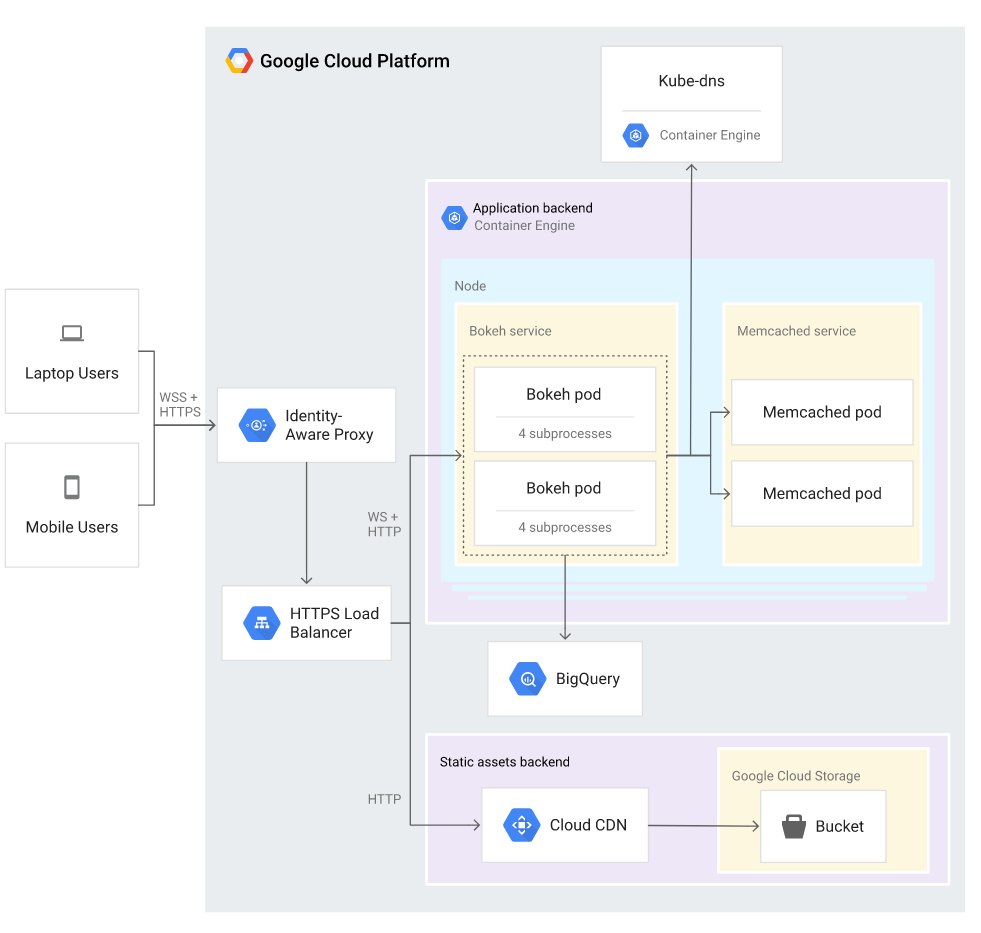
These elements include:
- Client web browsers on the desktop machines and mobile devices of the dashboard users.
- An authentication proxy managed by Cloud Identity-Aware Proxy, responsible for controlling access to the application.
- An HTTPS Load Balancer responsible both for effectively distributing incoming web traffic to the appropriate backends and for handling SSL decryption/encryption of data coming in and out of the system.
- The application backend responsible for serving the dashboard’s dynamic content (HTML and plot data).
- The static assets backend serving the static JavaScript and CSS files needed for client web browser rendering.
Application backend
The application backend receives incoming requests from the load balancer and then fetches and transforms the appropriate data from BigQuery. The backend returns the requested dynamic content, in the form of HTML over HTTP, and returns plotting data through WebSockets.
The following diagram shows the architecture:
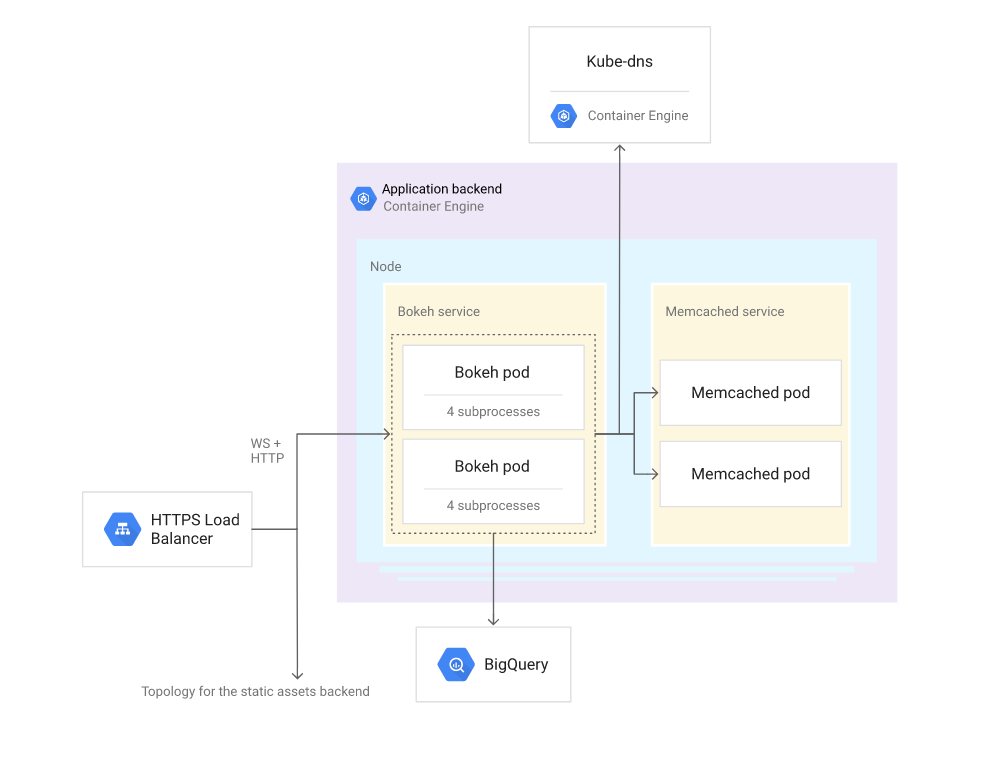
The application backend contains two main subcomponents:
- The Bokeh service. The application’s centerpiece, this service contains pods running the Bokeh servers that query data from BigQuery and generate the dynamic content consumed by the client web browsers.
- The Memcached service. Contains pods running Memcached servers that are responsible for caching frequently requested data.
These subcomponents exist in Docker containers and are deployed as Kubernetes pods to Kubernetes Engine to enable horizontal scalability.
Deploying the demo dashboard application
Initializing the environment
$ git clone https://github.com/GoogleCloudPlatform/bigquery-bokeh-dashboard

$ export ZONE=us-east1-c

$ gcloud config set compute/zone ${ZONE}
To allow the demo application to access BigQuery, create a service account key by running the following commands:
$ export PROJECT_ID=$(gcloud info --format='value(config.project)')

$ export SERVICE_ACCOUNT_NAME="dashboard-demo"

$ cd bigquery-bokeh-dashboard

$ gcloud iam service-accounts create $SERVICE_ACCOUNT_NAME \
--display-name="Bokeh/BigQuery Dashboard Demo"

$ gcloud projects add-iam-policy-binding $PROJECT_ID \
--member="serviceAccount:${SERVICE_ACCOUNT_NAME}@${PROJECT_ID}.iam.gserviceaccount.com" \
--role roles/bigquery.user

$ gcloud iam service-accounts keys create --iam-account \
"${SERVICE_ACCOUNT_NAME}@${PROJECT_ID}.iam.gserviceaccount.com" \
service-account-key.json
The Bokeh service
For this lab, the Bokeh service contains two Bokeh pods. Each pod runs a separate Bokeh server instance, which is a wrapper around Tornado’s non-blocking web server. This server can serve information synchronously over HTTP for HTML content and asynchronously through Websockets for the dashboard’s plotting data.
Each Bokeh server has been configured to fork into four different work subprocesses, reflected by the –num-procs parameter in the container Dockerfile’s CMD statement:
$ cat dashboard/Dockerfile
The Bokeh server automatically load balances incoming traffic between the subprocesses. This approach increases the performance and resilience of each pod. The number of subprocesses used in this tutorial is arbitrary. In a real-world scenario, you would adjust this number based on actual production traffic and the memory and CPU resources available in the cluster.
BigQuery is accessed directly from the Bokeh application by using the read_gbq method. For details, see the relevant documentation, available in the Pandas library’s gbq extension. This method has a very simple interface. It accepts a query as a parameter and submits it over the network to BigQuery. Other required parameters include the project ID and the service account key, both of which can be passed through environment variables loaded from Kubernetes secrets. The read_gbq method then transparently handles the pagination of results returned by BigQuery, and consolidates them into a single Pandas DataFrame object, which Bokeh can directly process.
As an illustration, here is an example of a query submitted with read_gbq to collect the top 100 most populated ZIP Codes in California (state code ‘CA’):
query = """
    SELECT
      A.zipcode,
      Population,
      City,
      State_code
    FROM
      `bigquery-public-data.census_bureau_usa.population_by_zip_2010` AS A
    JOIN
      `bigquery-public-data.utility_us.zipcode_area` AS B
    ON
     A.zipcode = B.zipcode
    WHERE
     gender = ''
    AND
     state_code = '%(state)s'
    ORDER BY
     population DESC
    LIMIT
     100
"""

import os
import pandas
dataframe = pandas.io.gbq.read_gbq(
   query % 'CA',
   project_id=os.environ['GOOGLE_PROJECT_ID'],
   private_key=os.environ['GOOGLE_APPLICATION_CREDENTIALS'],
   dialect='standard'
)
Note that, because the resulting data needs to travel over the network, offloading as much pre-processing to BigQuery as possible is highly recommended. For example, do any necessary downsampling at the query level (by using the LIMIT clause, targeting specific fields in the SELECT clause, pre-segmenting tables, or pre-grouping results using the GROUP BY clause) in order to reduce the overall network traffic and speed up response times.
Recall that the demo dashboard displays four different plot modules. When the user selects a U.S. state, the application sends four separate queries (one for each module) to BigQuery, processing a combined total of 7 gigabytes of data. Each of these BigQuery queries takes an average of 1 to 3 seconds to run. During this processing lapse, the application remains idle, waiting for the results to return from BigQuery. To optimize the dashboard’s overall response time, these four queries run in parallel on separate threads, as shown in the following code:
def fetch_data(state):
    """
    Fetch data from BigQuery for the given US state by running
    the queries for all dashboard modules in parallel.
    """
    t0 = time.time()
    # Collect fetch methods for all dashboard modules
    fetch_methods = {module.id: getattr(module, 'fetch_data') for module in modules}
    # Create a thread pool: one separate thread for each dashboard module
    with concurrent.futures.ThreadPoolExecutor(max_workers=len(fetch_methods)) as executor:
        # Prepare the thread tasks
        tasks = {}
        for key, fetch_method in fetch_methods.items():
            task = executor.submit(fetch_method, state)
            tasks[task] = key
        # Run the tasks and collect results as they arrive
        results = {}
        for task in concurrent.futures.as_completed(tasks):
            key = tasks[task]
            results[key] = task.result()
    # Return results once all tasks have been completed
    t1 = time.time()
    timer.text = '(Execution time: %s seconds)' % round(t1 - t0, 4)
    return results
When all the results have been received from BigQuery, Bokeh’s graph library plots the data. For example, the following code plots the evolution of air pollutant levels over time:
def make_plot(self, dataframe):
    self.source = ColumnDataSource(data=dataframe)
    palette = all_palettes['Set2'][6]
    hover_tool = HoverTool(tooltips=[
        ("Value", "$y"),
        ("Year", "@year"),
    ])
    self.plot = figure(
        plot_width=600, plot_height=300, tools=[hover_tool],
        toolbar_location=None)
    columns = {
        'pm10': 'PM10 Mass (µg/m³)',
        'pm25_frm': 'PM2.5 FRM (µg/m³)',
        'pm25_nonfrm': 'PM2.5 non FRM (µg/m³)',
        'lead': 'Lead (¹/₁₀₀ µg/m³)',
    }
    for i, (code, label) in enumerate(columns.items()):
        self.plot.line(
            x='year', y=code, source=self.source, line_width=3,
            line_alpha=0.6, line_color=palette[i], legend=label)

    self.title = Paragraph(text=TITLE)
    return column(self.title, self.plot)
Deploying the Bokeh service
To facilitate horizontal scalability for the application, all components of the application backend are deployed with Docker containers using Kubernetes. The steps for deploying these components to Kubernetes Engine follow.
First, create a Kubernetes Engine cluster, with an arbitrary number of 2 nodes, by running the following command in the Cloud Shell:
$ gcloud container clusters create dashboard-demo-cluster \
--tags dashboard-demo-node \
--num-nodes 2 \
--zone ${ZONE}
This will take a few minutes.
Now create Kubernetes secrets to securely store the project ID and the service account key that you created previously.
$ export PROJECT_ID=$(gcloud info --format='value(config.project)')

$ kubectl create secret generic project-id \
--from-literal project-id=$PROJECT_ID

$ kubectl create secret generic service-account-key \
--from-file service-account-key=service-account-key.json

// Create a static IP address:
$ gcloud compute addresses create dashboard-demo-static-ip --global
Define a domain using xip.io, a free DNS service that automatically resolves domains containing an IP address back to that same IP address:
$ export STATIC_IP=$(gcloud compute addresses describe \
dashboard-demo-static-ip --global --format="value(address)")

$ export DOMAIN="${STATIC_IP}.xip.io"

$ echo "My domain: ${DOMAIN}"
My domain: 34.98.97.233.xip.io
Create a Kubernetes secret with the domain:
$ kubectl create secret generic domain --from-literal domain=$DOMAIN
The Bokeh service is now ready to be deployed with this command
$ kubectl create -f kubernetes/bokeh.yaml
The last step deploys an arbitrary number of pods, in this case two, each one running a separate instance of the demo application. It also exposes as environment variables the three Kubernetes secrets created earlier through the env.valueFrom.secretKeyRef entry, so that this information can be retrieved by the application to access BigQuery.
For details, see bokeh.yaml.
$ kubectl get pods
NAME                     READY   STATUS    RESTARTS   AGE
bokeh-77f9857954-cf4vj   1/1     Running   0          109s
bokeh-77f9857954-tx528   1/1     Running   0          109s
The Memcached Service
When you don’t expect the data displayed on a dashboard to change for a given period of time, it’s important to consider performance and cost optimizations. For this purpose, and by default, BigQuery internally caches the results from duplicated queries for a period of twenty-four hours. This greatly speeds up response times and avoids unnecessary billing charges. You can find more information about this caching mechanism in the documentation.
This caching mechanism can be further improved by caching frequently used data locally inside the dashboard application’s memory. This approach takes BigQuery out of the loop and avoids unnecessary network traffic to collect the cached data. This tutorial uses Memcached to handle this type of application-level caching. Memcached is extremely fast and reduces response times from a few seconds to a few milliseconds in the case of this tutorial.
One peculiarity of Memcached is that it does not have a built-in load-balancing mechanism. Instead, load-balancing between multiple Memcached pods must be done by the Memcached client, which is included in each Bokeh pod, as illustrated in the following diagram:
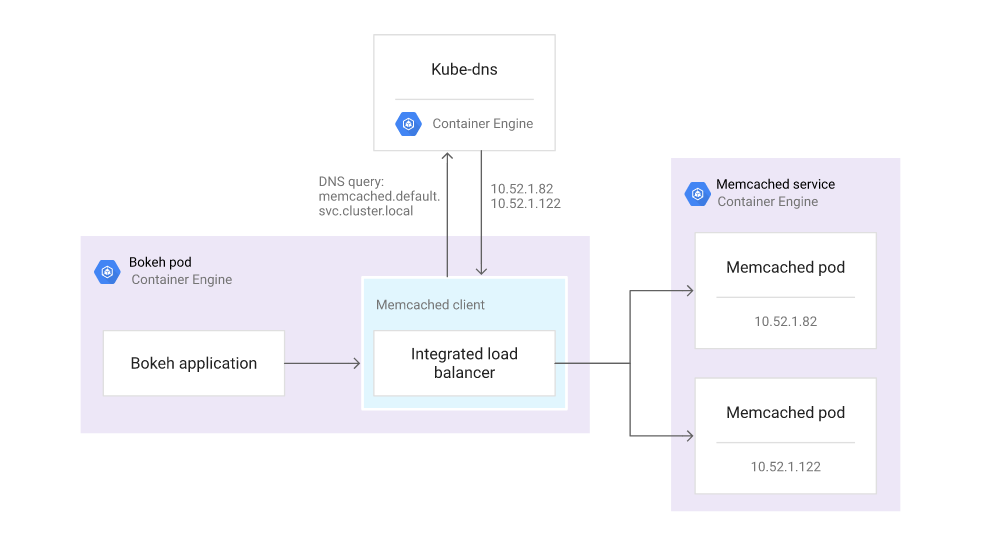
For the Memcached pods to be discoverable by the Memcached client, the Memcached service must be declared as headless, which is achieved by using the clusterIP: None entry in the Kubernetes configuration file (see memcached.yaml). The Memcached client can then retrieve IP addresses of the individual pods by querying kube-dns for the memcached.default.svc.cluster.local domain name.
Deploying the Memcached Service
Similar to the Bokeh service, the Memcached service is deployed by using a Docker container to Kubernetes Engine using Kubernetes.
Deploy the Memcached pods and headless service by running the following command:
$ kubectl create -f kubernetes/memcached.yaml
$ kubectl get pods
NAME                        READY   STATUS    RESTARTS   AGE
bokeh-77f9857954-cf4vj      1/1     Running   0          3m34s
bokeh-77f9857954-tx528      1/1     Running   0          3m34s
memcached-cd575b8f7-99lbw   1/1     Running   0          67s
memcached-cd575b8f7-vxmt2   1/1     Running   0          67s
Adding the load balancer
At this point, the dashboard application is running inside a private service. You need to introduce an HTTPS Load Balancer to expose the application to the Internet so users can access the dashboard. You will do this in three steps:
- Create an SSL certificate.
- Create a load balancer.
- Extend the connection timeout.
Creating an SSL Certificate
In real-world scenarios, data displayed on dashboards can be sensitive or private. You should use SSL to encrypt this data before it gets sent to the users over the Internet. The first step is to create an SSL certificate.
In a production setting, you would have to issue a certificate through an official Certificate Authority. For this lab, you can issue a self-signed certificate by running these commands:
$ export STATIC_IP=$(gcloud compute addresses describe \
dashboard-demo-static-ip --global --format="value(address)")

$ export DOMAIN="${STATIC_IP}.xip.io"

$ mkdir /tmp/dashboard-demo-ssl

$ cd /tmp/dashboard-demo-ssl

$ openssl genrsa -out ssl.key 2048
$ openssl req -new -key ssl.key -out ssl.csr -subj "/CN=${DOMAIN}"
$ openssl x509 -req -days 365 -in ssl.csr -signkey ssl.key -out ssl.crt
$ cd -
Creating the HTTPS Load Balancer
The HTTPS load balancer comprises multiple resources:
- A global forwarding rule.
- A health check.
- A backend service.
- A URL map.
- A target proxy.
To create all of those resources simultaneously included in the GitHub source repository:
$ ./create-lb.sh
Verify that the dashboard is live by visiting the URL returned by this command:
$ echo https://${STATIC_IP}.xip.io/dashboard
If your browser returns a “This site can’t be reached” message, the HTTPS load balancer is still being deployed. Traffic coming in and out of the system uses HTTPS and Secure WebSockets, while traffic inside the system remains unencrypted using regular HTTP and WebSockets. This level of encryption is sufficient in most scenarios. In a production environment, if you require extra security, consider enforcing SSL encryption in the GCP project’s Virtual Private Cloud (VPC) network. Setting up SSL encryption in the VPC network is out of scope for this tutorial.
Extending the connection timeout
By default, the HTTPS load balancer closes all connections that are open for longer than 30 seconds (for details, refer to the documentation).
To allow the dashboard’s WebSocket connections to stay open for a longer period of time, you need to increase the connection timeout. The following gcloud command sets the timeout to one day (86,400 seconds):
$ gcloud compute backend-services update dashboard-demo-service \
--global --timeout=86400
Redirecting static content delivery
The Bokeh pods can directly serve all the static JavaScript and CSS files required to render the dashboard. However, letting those pods handle this task has a number of drawbacks:
- It places an unnecessary load on the Bokeh pods, potentially reducing their capacity for serving other types of resources, such as the dynamic plotting data.
- It forces clients to download assets from the same origin server, regardless of where the clients are geographically located.
To alleviate those drawbacks, create a separate dedicated backend to efficiently serve static assets.
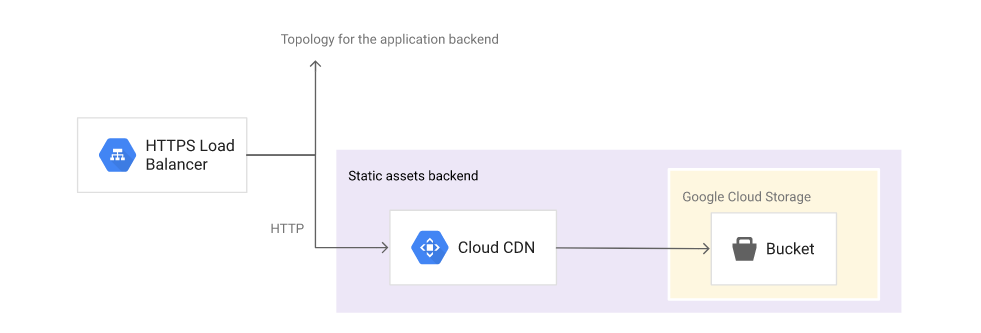
This static assets backend uses two main components:
- A bucket hosted in Cloud Storage, responsible for holding the source JavaScript and CSS assets.
- Cloud CDN, responsible for globally distributing these assets closer to potential dashboard users, resulting in lower latency and faster page loads.
The following diagram shows the architecture:
Creating the static assets backend
$ gcloud auth configure-docker --quiet

$ export DOCKER_IMAGE="gcr.io/cloud-solutions-images/dashboard-demo"

$ export STATIC_PATH=$(docker run $DOCKER_IMAGE bokeh info --static)

$ export TMP_PATH="/tmp/dashboard-demo-static"

$ mkdir $TMP_PATH

$ docker run $DOCKER_IMAGE tar Ccf $(dirname $STATIC_PATH) - \
static | tar Cxf $TMP_PATH -
Now create a bucket and upload all the assets to that bucket using the gsutil command included in the Google Cloud SDK:
$ export BUCKET="${PROJECT_ID}-dashboard-demo"

$ gsutil mb gs://$BUCKET
Upload the assets to the bucket
$ gsutil -m cp -z js,css -a public-read \
    -r $TMP_PATH/static gs://$BUCKET
The -z option applies gzip encoding to files with the js and css filename extensions, which saves network bandwidth and space in Cloud Storage, reducing storage costs and speeding up page loads. The -a option sets the permissions to public-read so that the uploaded assets can be publicly accessible by all clients.
Create the backend bucket, including Cloud CDN support using the –enable-cdn option:
$ gcloud compute backend-buckets create dashboard-demo-backend-bucket \
--gcs-bucket-name=$BUCKET --enable-cdn
Configure the load balancer to redirect static content
Connect the backend bucket to the HTTPS load balancer for all traffic requesting assets inside the /static/* directory:
$ gcloud compute url-maps add-path-matcher dashboard-demo-urlmap \
--default-service dashboard-demo-service \
--path-matcher-name bucket-matcher \
--backend-bucket-path-rules "/static/*=dashboard-demo-backend-bucket"
Verify that the CDN is working by checking that the response headers for static assets contain x-goog-* parameters:
$ curl -k -sD - -o /dev/null "https://${DOMAIN}/static/js/bokeh.min.js" | grep x-goog
If you get no response wait a few minutes and run the command again. The configuration change can take up to 10 minutes to propagate.
Once the CDN is working you will see a result similar to the following:
x-goog-generation: 1517995207579164
x-goog-metageneration: 1
x-goog-stored-content-encoding: gzip
x-goog-stored-content-length: 149673
x-goog-hash: crc32c=oIwVmQ==
x-goog-hash: md5=LDj7Jj8zw8kWdnQsOShEFg==
x-goog-storage-class: STANDARD
Controlling access with user authentication
While the SSL encryption previously enabled at the load balancer level protects the transport, it is a recommended practice to add an authentication layer in order to control access to the application and to prevent potential abuse. One option is to configure OAuth authentication and enable Cloud Identity-Aware Proxy.
Configure the OAuth consent screen for your application
Cloud Platform Console > APIs & Services > Credentials > OAuth consent screen
Application name: Demo Dashboard
Выполнить
$ echo "static-ip: ${STATIC_IP}"
Authorized domains: 34.98.97.233.xip.io
Save
Create > OAuth client ID.
Under Application type, select Web application.
Name: Dashboard demo
Authorized redirect URIs: https://[STATIC_IP].xip.io/_gcp_gatekeeper/authenticate
Create.
Save client ID and client secret shown in the OAuth client window. You will need them in the next step:
Click OK to close the OAuth client window.
Credentials > Oauth.2.0 > Dashboard demo > Authorized redirect URIs
Enable the Cloud Identity-Aware Proxy
Enable Cloud Identity-Aware Proxy by running the following commands in the Cloud Shell. Replace the [CLIENT_ID] and [CLIENT_SECRET] values with the actual values noted in the previous step:
$ gcloud beta compute backend-services update dashboard-demo-service --global \
--iap enabled,oauth2-client-id=[CLIENT_ID],oauth2-client-secret=[CLIENT_SECRET]
Finally, add a member to allow access to the application. Replace the [USER_ACCOUNT] value with the Qwiklabs username you used when starting the lab. The Username is in the Connection Details section of the lab.
$ gcloud projects add-iam-policy-binding $PROJECT_ID \
--role roles/iap.httpsResourceAccessor \
--member user:[USER_ACCOUNT]
This configuration change can take 5 to 10 minutes to propagate. When done, the application is protected by Cloud Identity-Aware Proxy, and only the user with the email address provided above can access it.
Refresh the dashboard in your browser (https://[STATIC_IP].xip.io) and you will be redirected to a Google user authentication page to select an existing authenticated user session or log in as a new user. You can add more users by using the same process detailed in the last step above.
У меня ошибка при редиректе.
Error: redirect_uri_mismatch